

WORLD AIRPORT DATA ANALYZER A360 (EN)
The interactive dashboard downloads data from the online update server – the first page load time is slightly longer.
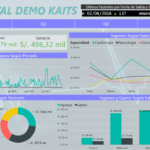
World Aiport Data Analyzer A360
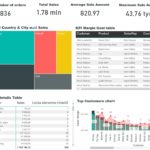
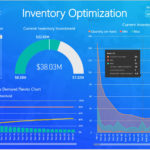
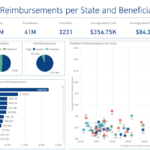
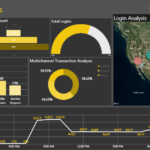
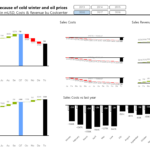
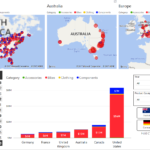
World Airports Analyzer is designed to monitor and analyze air traffic at airports around the world. Airport Analyzer collects and analyzes air traffic data such as number of flights, number of passengers, type of aircraft, airlines that use the airport and much more.
Thanks to airport analyzers, it is possible to predict trends and changes in air traffic, which is especially useful for air carriers, travel agencies and people planning a trip. Airport analyzers are also an important tool for airports and regulators, helping to make decisions regarding the development and modernization of aviation infrastructure.
The analyzer in public form only analyzes the condition of active airports with basic functions. The analytics details features mentioned above are available on A360 Premium only.
Practical Application
The airport data analyzer in the world helps to:
- identify active landing pads for airplanes within the appropriate standards,
- identify communication frequencies,
- identify the airport code,
-- locations of the height of the landing place,
- identify other necessary data.
Information on operating the dashboard Analyzer A360
1. We recommend operating in full screen view.
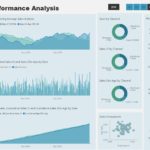
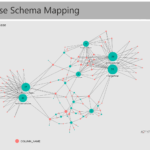
2. The analyzes are made in the multi-criteria analysis technology.
3. The filter panes of the statistics pages can be found on each left screen.
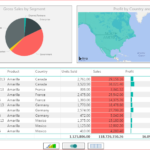
4. In some cases, by selecting a data on the chart, you can go to the detailed view of the chart.
5. By hovering over the data, a screen with additional information appears.
Skuteczność Formy Przekazu
Filtrowanie zawartości analiz jest wielopoziomowe w głąb danych oraz wielokryterialne.
Analizy mogą zawierać inteligentne systemy szukania i filtrowania.
Szablon wykonuje się tylko raz – następnie online aktualizuje się dane wejściowe.
Jedynym ograniczeniem widoków jest szablon, potrzeba, kultura biznesu oraz skuteczność przekazu.
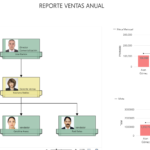
Formy Prezentacji Analiz
Monitor Zarządzania / Kokpit Menadżerski,
QR Code oraz link do online prezentacji Analizy A360 u Pracowników i Partnerów,
Generowanie PDF, Power point (eksport obrazu każdego widoku po włączeniu filtru przez Prezentera treści,
Eksport treści do formatu Excell.
Prezentacja widoków analiz na autoryzowanych telefonach.
Skuteczność Wizualizacji A360
Kilkaset szablonów, widoków wykresów,
Kilkaset form skutecznej prezentacji i przekazu treści,
Standardy naukowe skuteczności postrzegalności treści i przesłania marketingowego wyników.
Mobilność – zdolność do wizualizacji analiz firmowych na każdym nośniku z dostępem do internetu.
Standard wizualizacji – od roboczego (codziennej pracy) widoku do konferencyjnego oficjalnego.
Layout
Indywidualny Marki / Firmowy
Konferencyjny
Kooperacyjny
Strategiczny
Wydziałowy
Operacyjny
Klastrowy
Publiczny
Biblioteka Poglądowa Analiz / Raportów / Dashboard


Poziom Zadowolenia z Usług Analiz
Referencje